

Por José Luis Ricón
It has recently been found possible to estimate age, mortality risk, or general health by looking merely at the epigenome. The models used to do so are referred to as epigenetic (or methylation) clocks.
Epigenetic clocks are increasingly becoming a popular choice for scientists in the field of aging research to measure the putative efficacy of anti-aging interventions. They may make it possible to get results before full Kaplan-Meier curves are available, and they could serve, at least seemingly, as a replacement for a host of other biomarkers. I recommend reading the introductory sections of The Longevity FAQ as well as those about epigenetics before reading this post as it gives some more context.
Epigenetics
As a quick recap about epigenetics, the epigenome is a set of modifications to the DNA that do not alter the genetic code itself but regulates its expression and that enable cells to dynamically regulate their functions and maintain distinct states. Epigenetic marks take various forms, chiefly methylation of CpG sites—this is when a methyl group is attached to a C that is followed by a G—and also histone modification. Histones are proteins that form octamers around which the DNA is coiled. These histones have tails to which modifications can be made; typically acetylation (which opens up the chromatin and facilitates gene expression) or methylation (which can act both as a repressor and promoter of gene expression).
Most of these CpGs (70-80%) are methylated in mammalian tissue (Janitz & Janitz, 2011), but if one breaks looks only at clusters of CpGs, known as islands, only 6-8% of the islands are methylated in any one given tissue in humans (Illingworth et al., 2008): Given all the kinds of cells there are, a given cell only needs a fraction of the genes to be active to do its functions. CpG methylation patterns are not meant to change much in the adult. Once the cell is fully differentiated, the cells seems to assume everything is going to stay fine with these CpG methylations, and so it mostly loses the capacity to methylate additional CpGs, and/or their ability to protect (maintenance methylation) the methylated CpG islands is reduced (Cedar and Bergman, 2009, Jeltsch & Jurkowska 2014).
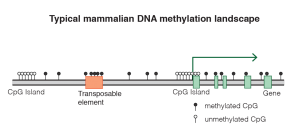
Methylation pattern (Source: Wikipedia)
As we age, a distinct pattern emerges in the CpGs: The islands that were methylated and supposed to stay so begin to lose their methyls, and extraneous methylation marks appear too where they are not supposed to be. It is still unclear if this happens in every cell or in a subset, as that would require single cell epigenetic sequencing studies that have not been done yet. And it is also important to remember that the CpGs that researchers have looked at until now for correlations with age are a small subset of the set of CpGs across the entire genome, looking at a few hundred at a time in general. Even the most advanced methylation microarray (the Illumina MethylationEPIC) can only assess 850k sites, 3% of the total count of CpGs).
The approach seems a promising research avenue: This pattern of aging occurs to some extent across species and this pattern seems to not be a mere reaction to damage outside of the cell but an intrinsic property that persists even when the young cells are transplanted to an old body or vice versa (Søraas et al. 2019)
Epigenetic aging is different from cellular senescence. Senescent cells don’t show up as aged in the clocks if senescence was induced via radiation or oncogene suppression; it is only in those cells that stay alive for long enough that they get epigenetically aged. Even if the cells are immortalized with telomerase, they still epigenetically age. Likewise, faster replication doesn’t make cells age faster; say you have a cell that in a period of time replicates itself faster and another that replicates slower, you then test the epigenetic age of cells in both populations at the end and they are similarly aged (Raj and Horvath, 2020). The paper claims that the only exception to this are embryonic stem cells, as «Extensive passaging of stem cells up to even a hundred times is not accompanied by increase in epigenetic age». However, the citation given to support that claim, an earlier paper from Horvath (2013) clearly says that «A significant correlation between cell passage number and DNAm age can also be observed when restricting the analysis to iPS cells or when restricting the analysis to ES cells». Perhaps the authors intend to revise the original results, noting that the large dispersion observed in the original data might point to the cell actually not aging. I contacted Ken Raj for clarification and he told me that
The reference can indeed cause confusion. While there appears to be a statistical correlation between ESC proliferation and age, this is not the case, when the data points are compared to the spread of ages of these cells, for which the vast majority are of pre-natal age regardless of the number of times they are passaged. Importantly I [Ken Raj] have repeated this experiment in my laboratory and can categorically confirm that proliferating ESC (and also iPSC) do not undergo epigenetic ageing. The new data will soon be published.
As embryonic stem cells are immortal (Saez et al. 2018) the result that they do not epigenetically age makes some a priori some sense. The probable outcome is that they do age, but very slowly, in a way echoing the results found for gametes and DNA mutations: They suffer them, but orders of magnitude less than the rest of cells.
A brief walk through the epigenetic clocks
Conceptually, epigenetic clocks are very simple. One starts from CpG methylation data and an endpoint of interest, such as age or mortality risk. Then one fits an elastic net model (a mixed L1/L2 penalized linear regression) so ultimately one gets
DNAmAge=a+b1CpG1+b2CpG2+….
This is good to frame a conservative case for the clocks: Unlike with fancier statistical techniques it is hard to fudge results using elastic nets; there are fewer hyperparameters to tweak, and being a simple model it is harder to overfit a training set.
The first generation of clocks is due to Hannum (2013) and Horvath (2015) who trained their models on cross-sectional data (people of different ages, but sampled only once each) to predict age. This worked really well, but didn’t work so well to predict how many years remaining one has.
So we got the second generation clocks, which used cohort data (the same people, measured multiple times over their lifetime) and trained to predict mortality directly: PhenoAge, presented in Levine et al.(2018) and GrimAge (Lu et al., 2019). The latter of the two is the most useful at predicting all-cause mortality (McCrory et al. (2020). One standard deviation increase in the GrimAge score increases the odds of not making it past 10 years by 18%.
Are the clocks picking something causal or a mere correlation?
Here we would want to manipulate the epigenome directly and see if we observe an aged phenotype. If we don’t then it means that the aged epigenome is a mere epiphenomenon and not something one can causally use as a target in drug development. Experiments to directly do this have not been done yet, so we only have indirect evidence.
David Sinclair mentions an experiment done with “ICE mice” (Inducible Changes to the Epigenome), genetically engineered mice that express on demand a gene that causes DNA double stranded breaks. On Sinclair’s theory, sirtuins—what they do is deacetylate proteins, mostly histones; and in turn this allows the chromatin to be more tightly packed, reducing gene expression around the deacetylated site—are typically acting to diminish gene expression in specific sites. But when there is a DNA (double-stranded) break, there is a need for deacetylation in the break which draws the sirtuins there to aid in the repair, but this reduces their deacetylating activity elsewhere: Genes that should be silent then become expressed.
Thus the ICE mice allow one to indirectly damage the epigenome through damaging the genome. Compared to a control group of ICE mice that had not been induced DNA damage, they were 50% older epigenetically. Phenotypically they showed all sorts of age-related conditions as loss of fur, body mass, muscle strength, or increase in arthritis and loss of sight.
Another example is epigenetic reprogramming: Genetically engineering mice that inducibly and transiently express a set of genes—reprogramming factors – that would generally move the cell towards an undifferentiated state—led to an increase in maximum and median lifespan (20 and 33% respectively) in progeroid mice. This shows up as rejuvenation in the epigenetic clocks (An example would be Figure 2e and Figure 2h of this preprint from the Sinclair lab). The OSKM paper from the Izpisua-Belmonte lab at the Salk Institute uses an antibiotic to trigger the OSKM factors, so one might think that perhaps the antibiotic is what causes the improvement in lifespan, but they had controls for precisely that. In the Sinclair lab paper, again in mice, they also looked at whether or not OSK is having its rejuvenating effects through remodeling the epigenome, so they tried to knock-out enzymes that are causally involved in remodeling the epigenome and the effect was greatly reduced, suggesting that the effects were mediated through epigenetic changes. In the paper, they cause an injury to the optic nerve in mice and then they treat the eye with the reprogramming factors. Besides observing regeneration of the nerve, they observe rejuvenation as measured by an epigenetic clock; and conversely upon inflicting damage they observe an increase in epigenetic age. But damage does not sound like aging, so why does it show up in the clocks?
There are at least three competing views as to what drives the ticking of these clocks: One is that it is just epigenetic noise that randomly gradually degrades the informational content of the epigenome. But another is that it reflects a programmed set of instructions that either causes aging (this is what the programmed aging camp claims) or that merely is a response to aging. The field is still trying to figure out exactly what exactly is it that the clocks are picking up (Field et al. (2018), Horvath (2013), Horvath (2020), Liu et al., 2019)
How good are the clocks, compared to something else?
To finish off, it is important to compare the clocks to other methods to do what the clocks do. For assessing chronological age as noted earlier the correlations are so high so as to put the relevant clocks (Like Horvath’s) among the top if not the top method to assess age. In the original Horvath clock, the average error is ~ 3.6 years.
For mortality things get more interesting. Sarah Constantin has compiled here a list of Hazard Ratios (HR) for various biomarkers. The idea here is to take a biomarker, in this case a measure of epigenetic age, take the top 5% and the bottom 5% scorers and do a ratio of how likely each group is to die on a given period. A good biomarker should have a high ratio, meaning that it is able to effectively discriminate between those that have higher and lower risk. A poor biomarker would have a HR=1, where knowing the value of the marker doesn’t give any information at all about relative risk. With that said, the GrimAge clock is the best clock to predict mortality so looking at it, the ratio in hazard ratios between the top 95 and bottom 5 in AgeAccelGrim (Difference between expected epigenetic age and real age), from the original paper is 4. This places it right at the top of the list as the best predictor there is in general[1]. For an intuitive comparison, the hazard ratio for mortality of smoking vs not smoking is 1.9 for smokers of 10 cigarettes a day relative to nonsmokers (Jacobs et al., 1999), so this again shows that clocks are indeed reliable tools when they are trained on the endpoints of interest.
Do longevity interventions known to work affect the clocks?
If we know rapamycin extends the lifespan of mice, if we give them rapamycin we should see an increase in their predicted lifespan in the clocks similar to that empirically observed for a cohort of rats. Does this happen?
At first, it seemed that no. Thompson et al. (2018) constructed 4 multi-tissue clocks for mice, finding accuracies comparable to other lifespan clocks of around 80%. The results were somewhat heterogeneous: They found positive effects for calories restriction: calorically restricted mice were 5 months younger (per the clocks) than mice fed a regular diet. With rapamycin they didn’t find an effect, fact they attribute to the small sample size (Just 4 mice in each group) or using a different sequencing technique .
Ames dwarf, which have achieved large (65%) increases in their maximum lifespan showed up as being epigenetically younger too, however the authors note that not all the clocks picked this up. I want to include here the rapamycin figure to also bring up the fact that the result might also have been a statistical fluke due to a single outlier
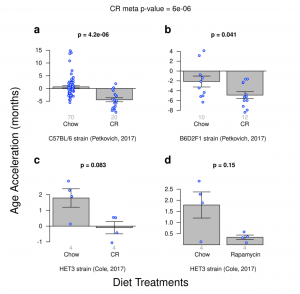
If you take out the odd outlier in the Chow group, then a result for rapamycin would be observed. Still, the effect ends up being smaller than for caloric restriction. Given this, we shouldn’t disregard the clocks just yet; we should look at more studies. And also, this clock is not the one we want to assess lifespan interventions: We want something that’s like GrimAge, trained to predict specifically years of life remaining.
Fortunately there are more studies:
Using 107 mice methylomes and 148 CpGs and normalization applied to account for the different sequencing methods, Wang et al. (2017) they developed a clock trained to predict age. Here they found uniformly larger differences: 9.4 decrease in epigenetic age as the effect of caloric restriction for age-matched mice, and 6 months for rapamycin, showing that perhaps CR mimetics may not be as good as CR itself. Young Drwarf Ames mice were slightly epigenetically younger than regular Ames mice, with older mice being 15 months younger, a result more intuitively coherent with the extended lifespan of these mice.
Petkovich et al. (2017) did a blood-based clock and found 20% lower epigenetic ages for calorically restricted mice; Dwarf mice appeared to be 50% younger, consistent with teir reported extended lifespan.
In yet another mice multitissue clock, Meer et al. 2018 instead split their predictions by tissue. For Snell Dwarf or CR mice the blood-based clock predicted its lifespan advantage. Oddly for Ames Dwarf mice (contrary to Petkovich) the lifespan effect was only found in a liver clock, a fact the authors attribute to the fact that
fewer than 90% of CpG sites used by other DNAm estimators were covered in these samples, while in the other intervention tests all clocks had high sites representation: more than 90% for each sample and more than 95% on average. Another reason for the failure to detect slowdown of aging in these samples might be that DNAm levels were estimated using WGBS. While the liver methylation clock was trained on both WGBS- and RRBS-produced samples, three other models studied here did not use WGBS-produced samples for training and thus they were expected to perform worse on these samples.
And finally, Schultz et al. (2019) developed GrimAge-style clocks (But using random forests instead of elastic net) to predict frailty (FRIGHT) and lifespan (AFRAID), assessing the same cohort of mice over their lifetime to avoid the biases discussed in en earlier section that plagued the first generation clocks. Clocks predicted survival at any age and showed slight improvements for methionine restriction (1.3 months longer lifespan) and enalapril (effect on health but not lifespan).
In a completely different context (and thus harder to extrapolate), rapamycin also shows up in the clocks in human cells in vitro (Lujan et al. 2019, Horvath et al., 2019).
So yes, looking at more rigorous tests involving cohort studies and experimental manipulations, methylation clocks work.
Conclusion
Even with a small number of the CpGs of the epigenome measured, it has been possible to construct clocks that accurately track age and health. We still don’t know exactly why the clocks work, just that they do. There is some interesting evidence pointing out to at least part of the pattern seem in the aged epigenome being causal, not just a reflection of the overall condition of the tissue or organism, so we may soon see the epigenome becoming a target for novel drugs.
If you want to continue reading about this, Bell et. al’s review (from where I extract the table below) and Raj and Horvath 2020 are the best starting points.
[1]. This doesn’t mean that for concrete cases we can’t find better markers. For example say you are 50 and are diagnosed with pancreas cancer (5-year survival is 7%). The odds of dying on a given year from old age in general would be 0.35%, so 1.73% chances of being dead after 5 years, yielding a HR of 93%/1.73%=53


Comentarios Recientes